Hundreds Chart
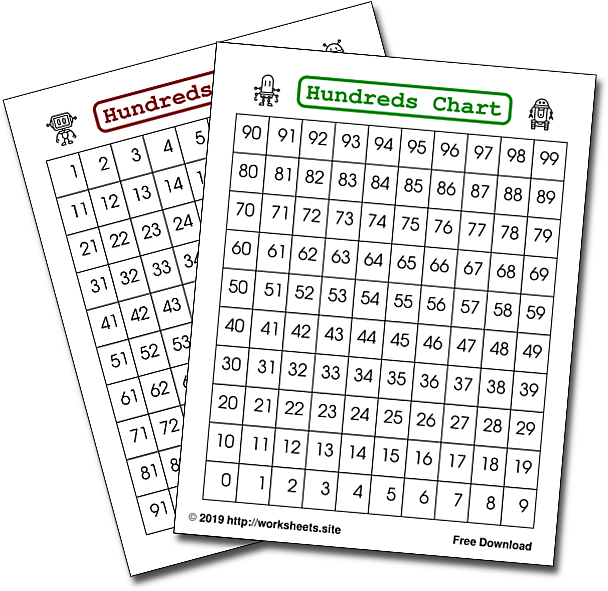
The 100s chart is a grid with 10 horizontal rows of cells and 10 vertical columns. All the natural numbers from 1 to 100 appear in this grid or table.
This chart is one of the essential resources that exist to learn counting in Early Childhood and Primary Education. It helps us introduce students to addition and subtraction, as well as to quickly become familiar with the numbers up to 100. At the same time, students learn the concepts of ones (units) and tens.
With a 100s chart we can explore addition and subtraction of numbers less than 100 with results which are also, obviously, less than 100.
Table of Contents
2. Benefits of the 0-99 chart
3. Bottoms Up! Flipped 100s charts
4. Free Printable 100s Charts
1. Uses of the Hundreds Chart
- To explain how the numbers work and their order. The chart can be projected on a digital board to make the task easier.
- To name all the numbers in the table as they learn them.
- Identify the next number, or the previous number.
- Learn the notion of distance between numbers:
- is 2 closer to 1 or 5?
- how far apart are the numbers 51 and 71
- 91 and 96 are 5 numbers apart, name other pairs of numbers that are 5 apart.
- To find number patterns:
- numbers plus 10 are in aligned vertically. As reminder to go down the hundred chart when counting by tens they can say "Ten more, through the floor".
- Odd and even numbers form vertical parallel lines.
- some number sequeces form diagonals.
- As coloring charts, children that are getting familiar with numbers can color sequences of numbers, skip counting them:
- 2, 4, 6, 8, ...
- 10, 20, 30, 40, ...
- or in reverse.
- Cross out the numbers that the teacher calls as a Bingo.
- Understand place value, for example, color the numbers that have a 4 in the tens place.
- Fill out incomplete charts, both in ascending and descending order.
- Round numbers to the nearest 10.
- Identify numbers between two values, for example, find a number between 27 and 42.
- Internalize a decisive insight in the first years of primary school: two digit numbers.
- Make a Sieve of Eratosthenes.
- Play mystery number games, by getting 2 or 3 clues about numbers, for example:
- The mystery number is less than 13.
- You can only land on the mystery number by skip counting by 5´s.
- As a verification aid in math games, or as a scoring chart, for example the "99" Card Game.
- As a reminder aid of puzzles, for example the Skip counting Connect the Dots.
2. Benefits of the 0-99 chart
A variation of the 100s Chart is the 0-99 chart, this is chart that instead of starting with 1 starts with 0 and goes up to 99.
- The numbers of one "ten" are on one row, for example all the 30s are in a single row from 30 to 39. A student physically needs to go to the next line to get to the next group of tens. This matches our counting structure.
- For some kids this is easier to comprehend visually and remember the next ten when they are counting. It´s especially helpful at 40 and 50 which both start with F and can be hard for young kids to remember sometimes.
- It includes the number Zero, which even though is not a counting number, it forms patterns with 10, 20, 30, ... Shows that 10 more than zero is 10, 20 more than zero is 20, etc.
- The 0-99 chart makes explicit that zero is an even number.
- If we consider the units of each number, the columns start with the first digit 0, and go right to the last digit 9.
3. Bottoms Up! Flipped 100s charts
Why do thermometers go from bottom to top, but hundreds charts from top to bottom?
If they build up from the bottom rather than starting at the top, that reinforces the concept of the magnitude of the numbers getting larger as they go up the chart rather than down. To move on a conventional chart we might say "move down two rows to show 20 more". If the chart starts at the bottom we would be saying "move up the chart to show 20 more".
On the other hand, starting at the top makes sense to the students who are learning to read left to right and top down.
When you add, let's say, 20 to a given number, you can see those hops of 10 are going up the chart, which just conceptually feels better to young kids, that we're going up because the number is getting bigger. And, if we were subtracting, we would be going down that chart.
Students can make better real life analogies like "It's like my carton of chocolate milk. When I drink some there´s less and it goes down. But when I spit it back in there´s more milk and it goes up."
4. Free Printable 100s Charts
The 1-100 chart is good for early counting, since it starts with a counting number. The 0-99 better visually represents our number system with digits 0-9 in the same row for each 10s. you can find patterns and structure in both of them. There is value in both. Let kids notice/wonder...
This file contains the 4 different versions of the chart, 1-100 top-down, 1-100 bottom-up, 0-99 top-down, 0-99 bottom-up, each with a header of different color. Download it in PDF format ![[PDF Document]](innards/pdf.png) . Use the password worksheets.site to open it.
. Use the password worksheets.site to open it.
The 4 different types of the 1000s chart are also available.

Similar Worksheets


Math Tables
1000s Chart Bottom Up and 0 to 99
How to convert Celsius to Fahrenheit or Kelvin
How to find the LCM of Numbers
Fractions to Decimal Chart PDF
How to find the Number of Combinations
Sieve of Eratosthenes Step by Step
Numbers
1000s Chart Bottom Up and 0 to 99
Number Cards with Factorization Diagrams
Connect the Dots with Roman Numbers
Number Cards for Counting and Number Talks
Number Tracing Worksheets for Preschoolers
Place Value Mastermind with Robots
Little Red Riding Hood Number Paths
Number Sense
1000s Chart Bottom Up and 0 to 99
Number Cards with Factorization Diagrams
100 Dot to Dot Mystery Puzzles
Mystery Pictures for Comparing Numbers
Number Cards for Counting and Number Talks
Little Red Riding Hood Number Paths
Home Page
